Mario Carrion


What is OpenTelemetry?
Source (emphasis mine):
OpenTelemetry is a set of APIs, SDKs, tooling and integrations that are designed for the creation and management of telemetry data such as traces, metrics, and logs. The project provides a vendor-agnostic implementation that can be configured to send telemetry data to the backend(s) of your choice.
In a way OpenTelemetry was the indirect result of observability, where the need to monitor multiple services written in different technologies made harder to collect and aggregate observability data.
OpenTelemetry does not provide concrete observability backends but rather a standard way to configure, emit, collect, process and export telemetry data; there are commercially-supported options for those backends, like NewRelic and Lightstep, as well as some Open Source projects that can be used with it, for this post I’m covering specifically:
- Prometheus for collecting metrics, and
- Jaeger for collecting traces
OpenTelemetry support for logs in Go, to date, is not implemented yet, however I’m still showing you how to log data using Uber’s zap.
Using OpenTelemetry in Go
At the moment the following is the OpenTelemetry status regarding the support in Go:
- Tracing Beta
- Metrics Alpha
- Logging Not yet implemented
The official documentation describes the steps required for adding OpenTelemetry support to Go programs, although the implementation has not reached a major official release we can still use it in production. There’s also a registry that lists different packages for Go that implement instrumentation or tracing.
The code used for this post is available on Github.
Metrics
For collecting metrics Prometheus will be used. To define this exporter the official OpenTelemetry-Go Prometheus Exporter is used as following:
promExporter, _ := prometheus.NewExportPipeline(prometheus.Config{}) // XXX: error omitted for brevity
global.SetMeterProvider(promExporter.MeterProvider())
This exporter implements http.Handler, so we can define it as another endpoint part of our HTTP Server, which then Prometheus will be using for polling metric values:
r := mux.NewRouter()
r.Handle("/metrics", promExporter)
One important thing about this is that because Prometheus is polling values from our service we must indicate what address and port to use, because we are using docker there’s a configuration file that includes:
scrape_configs:
- job_name: to-do-api
  scrape_interval: 5s
  static_configs:
  - targets: ['host.docker.internal:9234']
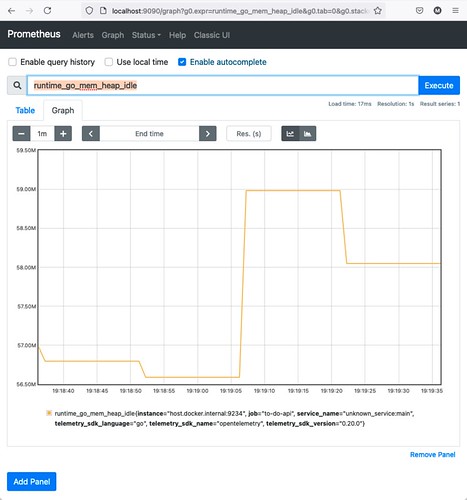
Visiting http://localhost:9090/ should display a user interface like the following after typing a metric and selecting it:
Tracing
For collecting metrics Jaeger will be used. Compared to the Metrics one, defining this exporter is a slightly more elaborated. It requires the following:
jaegerEndpoint, _ := conf.Get("JAEGER_ENDPOINT")

jaegerExporter, _ := jaeger.NewRawExporter(
	jaeger.WithCollectorEndpoint(jaegerEndpoint),
	jaeger.WithSDKOptions(sdktrace.WithSampler(sdktrace.AlwaysSample())),
	jaeger.WithProcessFromEnv(),
) // XXX: error omitted for brevity

tp := sdktrace.NewTracerProvider(
	sdktrace.WithSampler(sdktrace.AlwaysSample()),
	sdktrace.WithSyncer(jaegerExporter),
)

otel.SetTracerProvider(tp)
otel.SetTextMapPropagator(propagation.NewCompositeTextMapPropagator(propagation.TraceContext{}, propagation.Baggage{}))
Defining that is the first step for having complete tracing support in our program, next we have to define Spans, either manually or automatically depending on the existing wrapper we are planning to use for whatever we want to trace; in our case we are doing it manually.
For example in the postgresql package each method of each type defines instructions like the following:
ctx, span := trace.SpanFromContext(ctx).Tracer().Start(ctx, "<name>")
 // If needed: N calls to "span.SetAttributes(...)"
defer span.End()
For example in postgres.Task.Create, we have:
ctx, span := trace.SpanFromContext(ctx).Tracer().Start(ctx, "Task.Create")
span.SetAttributes(attribute.String("db.system", "postgresql"))
defer span.End()
The OpenTelemetry specification defines a few conventions regarding attribute names and supported values, so the attribute db.system we used above is part of the Database conventions; in some cases the go.opentelemetry.io/otel/semconv package defines constants we can use, but this is not always the case so keep an eye out.
Similarly the equivalent service.Task.Create method does the following:
ctx, span := trace.SpanFromContext(ctx).Tracer().Start(ctx, "Task.Create")
defer span.End()
This is so we can record the call from each layer to measure how much time it took to complete as well as any possible errors that happen. Visiting http://localhost:16686/search should display a user interface like the following:
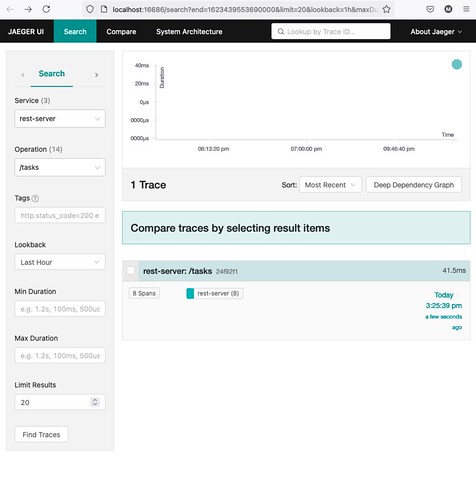
After clicking “Find Traces” we should see something like:
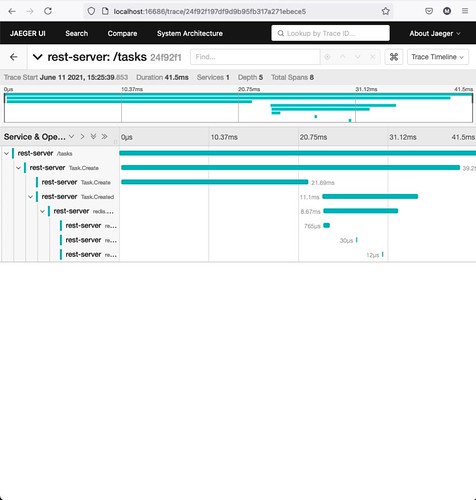
Where each Span is a layer that describes the interactions taken by the whole call. The interesting thing about OpenTelemetry and spans is that if there are interactions that include other OpenTelemetry-enabled calls, we could join them to see the full interaction between all of them.
Logs
Although OpenTelemetry does not support logs in Go yet, logging certain messages should be considered when Building Microservices; the approach I like to recommend is to define a logger instance and then when needed pass it around as an argument when initializating concrete types, the package we are going to be using is uber-go/zap.
Our code implements a middleware to log all requests:
logger, _ := zap.NewProduction()
defer logger.Sync()

middleware := func(h http.Handler) http.Handler {
	return http.HandlerFunc(func(w http.ResponseWriter, r *http.Request) {
		logger.Info(r.Method,
			zap.Time("time", time.Now()),
			zap.String("url", r.URL.String()),
		)

		h.ServeHTTP(w, r)
	})
}
Which then we use to wrap the muxer and therefore all the handlers:
srv := &http.Server{
	Handler: middleware(r),
	// ... other fields ...
}
Conclusion
OpenTelemetry, for Go specifically, is a work in progress, it’s definitely a good idea but it is hard to keep your own code up to date with the minor releases, because those happen to break API from time to time. For long running projects I’d recommend to wait until a major version is released, otherwise finding a non-OpenTelemetry option may make more sense.
I will continue monitoring the progress of this project in future posts, until then I will talk to you later.